Aug 23, 2026
Tap Water Quality in Brazil
From ETL to Analysis
ETL • Python • SQL • Docker • Airflow • DAG • Data Studio
Overview
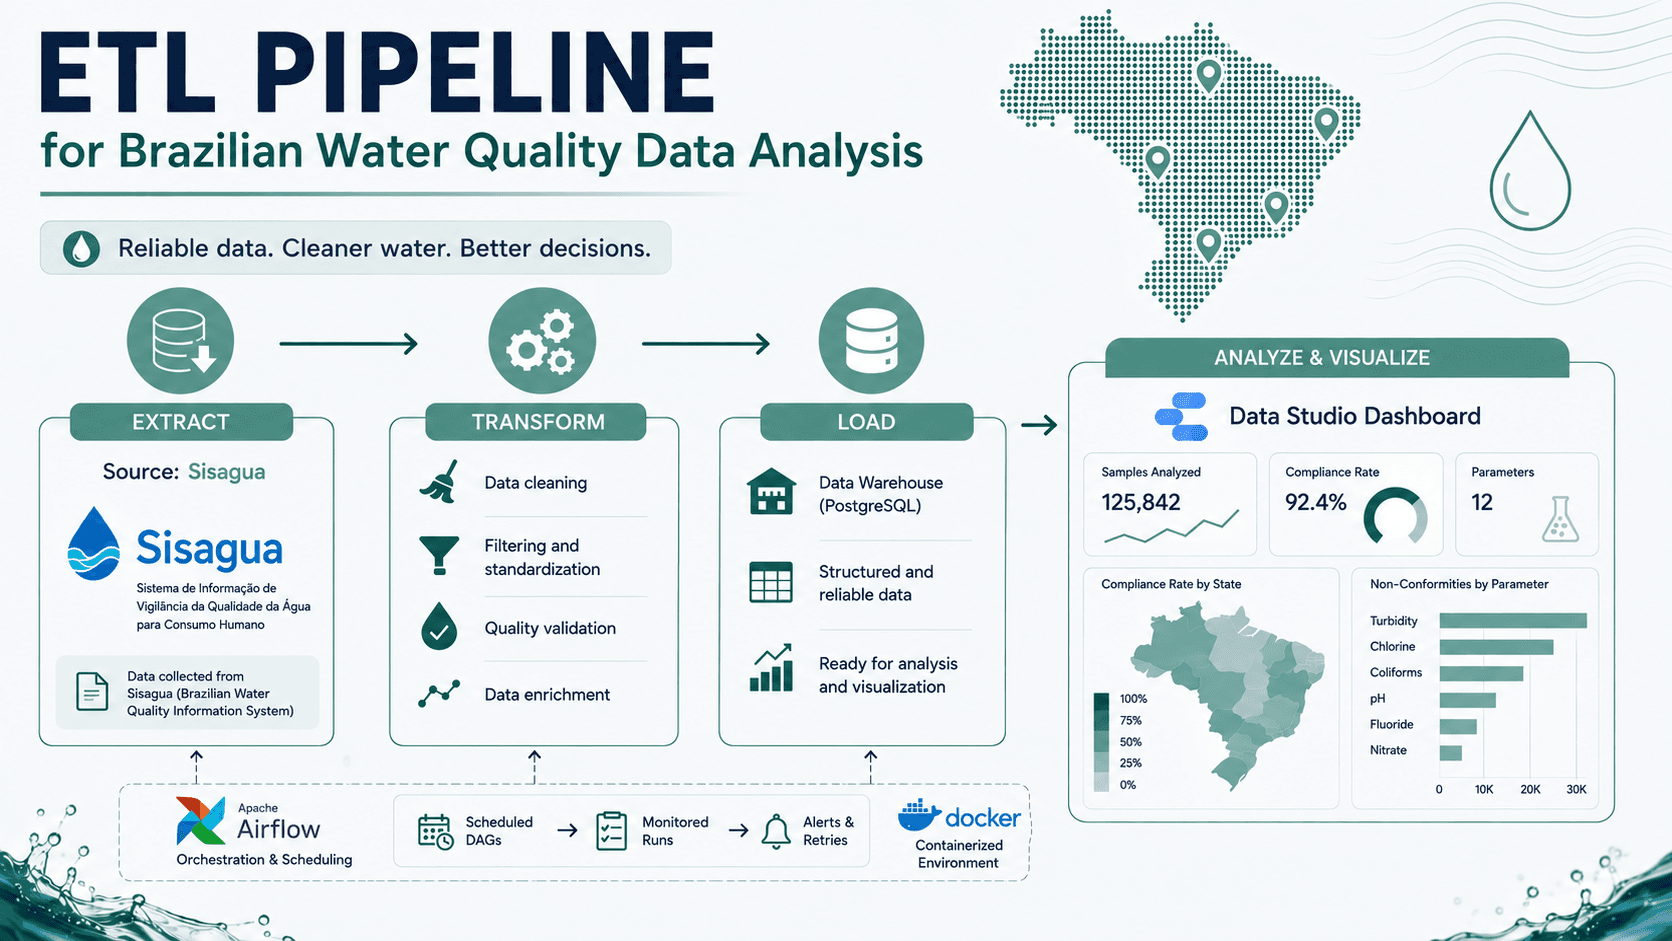
I rebuilt a real-world water quality data pipeline from the ground up. It now pulls, cleans, and serves 2.3M+ records straight from Brazil's open government water-quality API (SISAGUA), fully automated and running on free-tier infrastructure. The output is a live dashboard, embedded below, plus the same email report tool the project started as: drop in a Brazilian zip code and get back what's actually in the local tap water.
Architecture
Raw records come in through SISAGUA's open-data API, get cleaned and transformed in Python, and land in a PostgreSQL database. Rather than storing the API response as-is, I designed the schema around the questions the BI layer actually needs to answer — not a raw dump. Airflow orchestrates the whole pipeline on a schedule, running fully containerized in Docker, with separate paths for incremental loads (day-to-day updates) and full historical loads (rebuilding from scratch); the same containers produce the same result whether the pipeline is processing a small update or rebuilding the full historical dataset. Data-quality validation runs automatically before anything reaches the dashboard, and Looker Studio reads straight from Postgres for the dashboard below.
Engineering Challenges
SISAGUA's API has five documented endpoints that looked like they covered everything I needed. I built against all five, then noticed one — the one that was supposed to carry metals and pesticide readings — was returning the same single microbiological parameter over and over, hundreds of thousands of records in. Going back to the full API spec instead of the five endpoints I'd been pointed to, I found a different one entirely: a semester-based endpoint that actually had the metals, pesticides, and organic compound data, with the safety threshold for each parameter built right into the record.
That safety threshold — VMP, the maximum allowed value per parameter — turned into the most interesting engineering decision in the project. My first instinct was to hardcode Brazil's official potability limits. Then I found the limits themselves change over time as the regulation gets revised — a threshold pulled from 2022 data was already outdated by 2024. So instead of hardcoding anything, the pipeline models the threshold as time-dependent: each water sample is validated against the VMP that was actually in effect on the date it was collected. It's a small design choice, but it's the difference between data that looks right and data that is right.
The rest of the build was the usual pile of infrastructure issues that don't show up until you run things end to end: a newer major version of Airflow deprecated part of the API my existing DAGs were built against, so upgrading meant rewriting the affected task definitions; Docker's default networking couldn't reach Supabase's direct connection at all because it's IPv6-only, fixed by switching to Supabase's connection pooler; and a couple of unpinned dependencies in an old requirements file broke cleanly in a fresh container despite having worked fine in a stale local environment for years. None of these are exotic problems — they're the kind of thing you only catch by actually deploying, not by reading the code and assuming it's fine.
What Changed Since 2023
This isn't a new idea. Back in 2023 I built a version of this for an e-commerce client: pull a customer's zip code, look up local tap water quality, send them a report. It worked, but SISAGUA didn't have a public API yet, so it ran on manually-wrangled bulk CSV exports — heavier and more expensive to operate than it needed to be. Revisiting it now wasn't about redoing the same thing; it was about rebuilding the underlying data architecture properly, now that a real API exists: automated ingestion instead of manual CSVs, a schema and validation layer instead of ad hoc cleaning, and a live dashboard instead of email-only output. The email report is still part of the project — it's below — but the platform behind it is a different piece of engineering entirely.
Try It Yourself
Want to see the pipeline in action? Drop your email and a Brazilian zip code below to receive a full water-quality report for that location — the same report the original 2023 version sent, now running on this rebuilt platform. (And if you read a data pipeline write-up all the way to the bottom: respect.)